JavaScript not enabled! Heatmapper requires JavaScript to be enabled in your browser in order to function. To enable JavaScript, do one of the following:

In Google Chrome:
  1. Click the Chrome menu icon on the browser toolbar.
  2. Select Settings.
  3. On the "Settings" page, click the Show advanced settings... link at the bottom.
  4. In the "Privacy" section, click Content settings...
  5. Select Allow all sites to run JavaScript (recommended) in the "JavaScript" section.
  6. Click Done.
  7. Refresh your Heatmapper page.
In Windows Internet Explorer:
  1. On the Tools menu, click Internet Options, and then click the Security tab.
  2. Click the Internet zone.
  3. If you do not have to customize your Internet security settings, click Default Level. Then do step 4.

    If you have to customize your Internet security settings, follow these steps:
    1. Click Custom Level.
    2. In the Security Settings – Internet Zone dialog box, click Enable for Active Scripting in the Scripting section.

  4. Click the Back button to return to the previous page, and then click the Refresh button to refresh Heatmapper.
In Mozilla Firefox:
  • In Firefox, JavaScript is enabled by default, but may be blocked if a privacy extension such as NoScript or Ghostery was installed. Please edit the settings for the particular extension you have installed to un-block Heatmapper.


In Apple Safari:
  1. From the Safari (on Mac) or Edit (on Windows) drop-down menu, select Preferences...
  2. Select the Security icon/tab at the top on the window.
  3. Then, check the Enable JavaScript checkbox.
  4. Refresh your Heatmapper page.

Welcome to Heatmapper!

Click in the menu above or on the buttons below to start making your heat map!

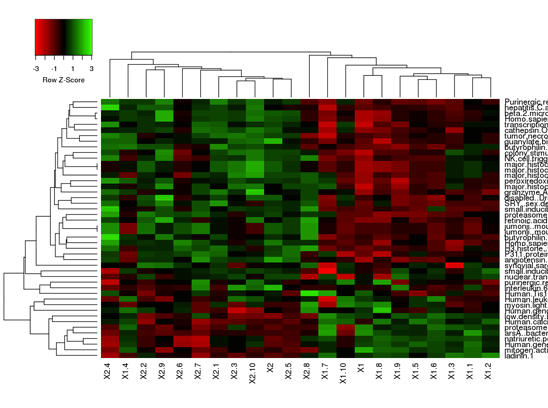
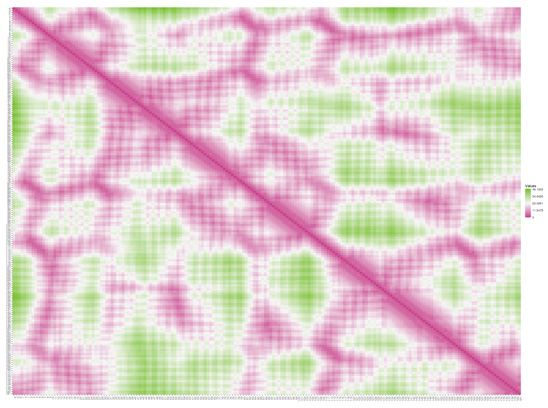
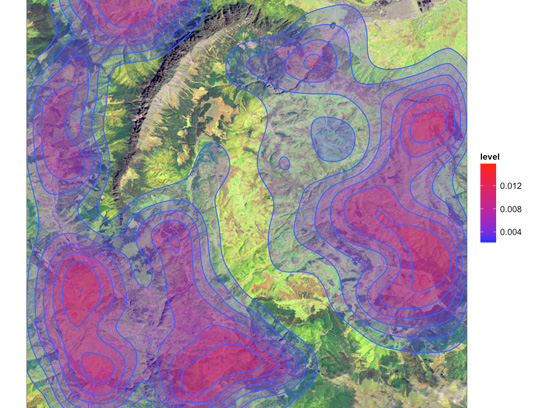
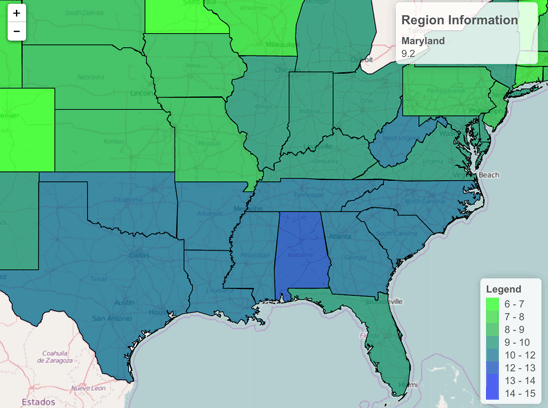
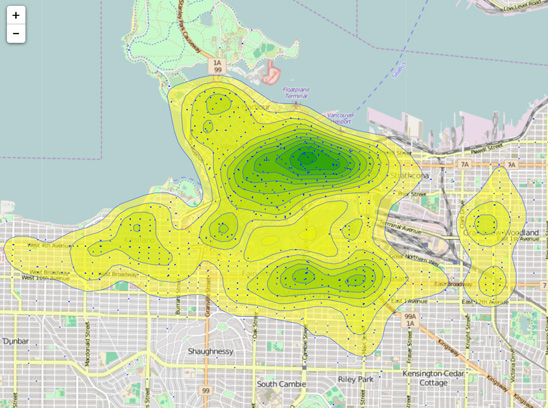
Heatmapper is a freely available web server that allows users to interactively visualize their data in the form of heat maps through an easy-to-use graphical interface. Heatmapper is a versatile tool that allows users to easily create a wide variety of heat maps for many different data types and applications. Heatmapper allows users to generate, cluster and visualize: 1) expression-based heat maps from transcriptomic, proteomic and metabolomic experiments; 2) pairwise distance maps; 3) correlation maps; 4) image overlay heat maps; 5) latitude and longitude heat maps and 6) geopolitical (choropleth) heat maps. Heatmapper offers a number of simple and intuitive customization options for easy adjustments to each heat map’s appearance and plotting parameters. Heatmapper also allows users to interactively explore their numeric data values by hovering their cursor over each heat map, or by using a searchable/sortable data table view.

Please cite:

Sasha Babicki, David Arndt, Ana Marcu, Yongjie Liang, Jason R. Grant, Adam Maciejewski, and David S. Wishart. Heatmapper: web-enabled heat mapping for all. Nucleic Acids Res. 2016 May 17 (epub ahead of print). doi:10.1093/nar/gkw419


Funding

Expression
Expression
Show Details

Displays unclustered expression data, such as from a microarray experiment, as a heatmap. Hierarchical clustering can also be performed on the data and the resulting dendrogram can be viewed.

Input Formats: Comma-Separated Values (.csv), Tab Delimited (.txt, .dat, .tsv, .tab), or Microsoft Excel (.xls, .xlsx).
Example Usage: Cluster and visualize the results of a DNA microarray experiment to analyze gene expression levels
Number of Features: 18
pairwise comparison
Pairwise Comparison
Show Details

Displays heatmap of user data either as a distance matrix, as a correlation matrix, or as-is.

Input Formats: Comma-Separated Values (.csv), Tab Delimited (.txt, .dat, .tsv, .tab), Microsoft Excel (.xls, .xlsx), or Protein Data Bank format (.pdb).
Example Usage: Visualize pairwise distances for predicting protein structure
Number of Features: 14
image overlay
Image Overlay
Show Details

Displays a heatmap of densities based on values at plot coordinates corresponding to an image.

Input Formats: Comma-Separated Values (.csv), Tab Delimited (.txt, .dat, .tsv, .tab), or Microsoft Excel (.xls, .xlsx) for the data values. For the image upload, PNG (.png), JPEG (.jpeg or .jpg) or TIFF (.tiff or .tif) formats are supported.
Example Usage: Create a custom heatmap of measured bacterial presence and abundance on different parts of the body
Number of Features: 18
geomap
Geomap
Show Details

Displays a choropleth heatmap specified by values assigned to locations based on political boundaries.

Input Formats: Comma-Separated Values (.csv), Tab Delimited (.txt, .dat, .tsv, .tab), or Microsoft Excel (.xls, .xlsx).
Example Usage: Visualize disease prevalence by country
Number of Features: 12
Geocoordinate
Geocoordinate
Show Details

Displays a heatmap of densities based on values assigned to locations specified by latitude and longitude coordinates. Density estimation calculation can be performed based on density of points or weighted by values specified for each coordinate.

Input Formats: Comma-Separated Values (.csv), Tab Delimited (.txt, .dat, .tsv, .tab), or Microsoft Excel (.xls, .xlsx).
Example Usage: Visualize observed animal population densities in a region
Number of Features: 13
about

About

Show Details

Provides information about heatmapper.ca. The about section contains four subsections: Instructions, Gallery, Contact, and GitHub.

Instructions: View instructions on how to use each section
Gallery: View a gallery of examples
Contact: Get the contact information for the author of heatmapper.ca and additional information about the project
GitHub: View the project source code
Questions or comments? Please use our feedback page. License: CC-BY-SA